Study the following table and answer the questions.
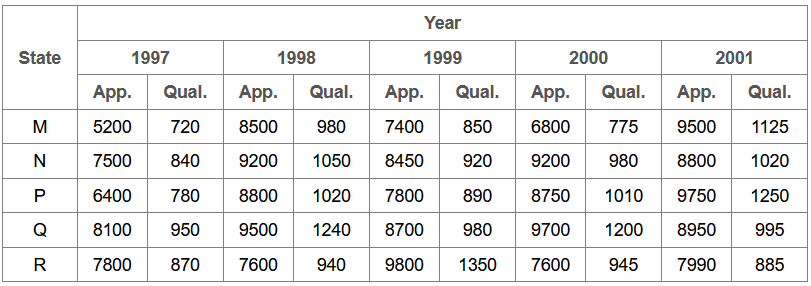
Number of Candidates Who Appeared and Qualified in a Competitive Examination from Different States Over the Years.

10.87%
11.49%
12.35%
12.54%
Correct answer is C
Required percentage = [ (1020 + 1240)/(8800 + 9500) x 100 ] %
= [ 2260/18300 x 100 ] %
= 12.35%.
Study the following table and answer the questions.
Number of Candidates Who Appeared and Qualified in a Competitive Examination from Different States Over the Years.

11.49%
11.84%
12.21%
12.57%
Correct answer is B
Required percentage = [ (850 + 920 + 890 + 980 + 1350)/(7400 + 8450 + 7800 + 8700 + 9800) x 100 ] %
= [ 4990/42150 x 100 ] %
= 11.84%.
Study the following table and answer the questions.
Number of Candidates Who Appeared and Qualified in a Competitive Examination from Different States Over the Years.

12.36%
12.16%
11.47%
11.15%
Correct answer is D
Required percentage = [ (840 + 1050 + 920 + 980 + 1020)/(7500 + 9200 + 8450 + 9200 + 8800) x 100 ] %
= [ 4810/43150 x 100 ] %
= 11.15%
Study the following table and answer the questions.
Number of Candidates Who Appeared and Qualified in a Competitive Examination from Different States Over the Years.
1997
1998
1999
2001
Correct answer is D
The percentages of candidates qualified to candidates appeared from State P during different years are:
For 1997 ( 780/6400 x 100 ) % = 12.19%
For 1998 ( 1020/8800 x 100 ) % = 11.59%
For 1999 ( 890/7800 x 100 ) % = 11.41%
For 2000 ( 1010/8750 x 100 ) % = 11.54%
For 2001 ( 1250/9750 x 100 ) % = 12.82%
Therefore Maximum percentage is for the year 2001.
Study the following table and answer the questions.
Number of Candidates Who Appeared and Qualified in a Competitive Examination from Different States Over the Years.

What is the average candidates who appeared from State Q during the given years?
8700
8760
8990
8920
Correct answer is C
Required average = (8100 + 9500 + 8700 + 9700 + 8950)/5
= 44950/5
= 8990
Aptitude Tests
Latest Jobs
Zonal Administrative Assistant at World Health Organization (WHO)
Officer - Payroll at MTN Nigeria
Supervisor - Warehouse at MTN Nigeria
Customer Services Representative at Tetra Pak
Community Engagement and Monitoring Assistant at World Health Organization (WHO)
Customer Service Representative at Eric Kayser
Training Manager at United Nigeria Airlines
Financial Controller at United Nigeria Airlines
Data Entry Clerk at Jolly Energy Fleet Limited